
Download
Download
Examples of contents
Earth/Moon/Planets

Earth/Moon/Planets
Earth, City light of the Earth, Moon, Mars, Jupiter and Io (a satellite of the Jupiter)
Made by Dagik Team
Images were provided by NASA, NASA/JPL-Caltech., and U.S. Geological Survey
Download Image (10Mbyte)

Waxing and waning Moon
The sunlit and shadow areas of the Moon for each day. It is easy to understand that the waxing and waning of the Moon is caused by the rotation of the sunlit/shadow area.
Made by Dagik Team
The Moon's surface image was provided byU.S. Geological Survey. The contrast of the image was
modified.
Download Image (38Mbyte)

Day and night of the Earth
Day and night area of the Earth for four seasons. The seasonal change of the length of the day/night can be seen.
Made by Dagik Team
Earth's land Image: NASA Blue Marble by
NASA's Earth Observatory (Ocean color is changed.)
Download March (7Mbyte)
Download June
(7Mbyte)
Download September
(7Mbyte)
Download December
(7Mbyte)
Download June and
September (14Mbyte)

Global Forest/Non-forest Map
Global Forest/Non-forest Map in 2009 by ALOS/PALSAR Observation
ALOS/PALSAR data Copyright: JAXA/METI
Data analysis:JAXA http://www.jaxa.jp/projects/sat/alos
Download low resolution (1.4Mbyte)
Download high resolution (3.2Mbyte)

Seasonal Change of the Earth's Surface
Monthly image of the Earth's land in 2004 by NASA Blue Marble
Made by Dagik Team
Earth's land Image: NASA Blue Marble by NASA's Earth Observatory (Ocean color is changed.)
Download Image (4.9Mbyte)
Geospace
Aurora
Aurora observed by FUV on the NASA's IMAGE satellite. Rings of aurora surrounded the both poles.
Made by Dagik Team
IMAGE/FUV images were provide by SSL, University of California, Berkeley
(http://sprg.ssl.berkeley.edu/image/).
Earth's land Image: NASA Blue Marble by NASA's Earth Observatory (Ocean color is changed.)
Download: in preparation
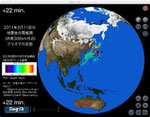
Ionospheric disturbance after the earthquake
Variations of the ionospheric plasma after the 2011 Tohoku earthquake on March 11, 2011
Made by Dagik Team
GPS Observation by GEONET of GSI Japan
Data: GPS Total Electron Content database http://stegps.kugi.kyoto-u.ac.jp/
Earth's land Image: NASA Blue Marble by NASA's Earth Observatory (Ocean color is changed.)
Download image (164Mbyte)
Atmosphere/Ocean

Typhoon to Japan (October, 2009)
Evolution of a typhoon in two weeks. Typhoon moved from east to west at the begining, and turned to east, and landed main island of Japan.
Made by Dagik Team
Cloud image is based on the data of NCEP/CPC 4km Global IR Dataset by the Tropical Rainfall Measuring Mission (TRMM).
Earth's land Image: NASA Blue Marble by NASA's Earth Observatory (Ocean color is changed.)
Download Image (254Mbyte)

Cyclone near Madagascar (February, 2008)
Evolution of a cyclone near Madacascar. The movement of the vortex is differrent from that in the noruthern hemisphere.
Made by Dagik Team
Cloud image is based on the data of NCEP/CPC 4km Global IR Dataset by the Tropical Rainfall Measuring Mission (TRMM).
Earth's land Image: NASA Blue Marble by NASA's Earth Observatory (Ocean color is changed.)
Download Image (102Mbyte)

Cyclone location & Sea surface temperature (1980-2007)
Locations of the tropical cyclone generation were plotted on the sea surface temperature map.
Made by Dagik Team
Sea surface temperature data:
ERSST.v2 by NOAA's National Climatic Data Center [http://www.ncdc.noaa.gov/]
Tropical cyclone track data: IBTrACS by World Data Center for Meteorology, Asheville
Earth's land Image: NASA Blue Marble by NASA's Earth Observatory (Ocean color is changed.)
Download Image (334Mbyte)

Sea surface temperature (SST) in December from 1980 to 2007
Made by Dagik Team
Sea surface temperature data: ERSST.v2 by NOAA's National Climatic Data Center [http://www.ncdc.noaa.gov/]
Earth's land Image: NASA Blue Marble by NASA's Earth Observatory (Ocean color is changed.)
Download Image (12Mbyte)

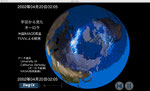
Ozone distribution in 2002 and 2003
Ozone distribution observed by a satellite. The ozone hole appeared from September to November over antarctica.
Made by Dagik Team
Total ozone data was obserbed and provided by NASA's TOMS and OMI, http://toms.gsfc.nasa.gov/.
Earth's land Image: NASA Blue Marble by NASA's Earth Observatory (Ocean color is changed.)
Download Image (292Mbyte)

Ozone hole in the northern hemisphere
Ozone distribution observed by a satellite from February to April in 2010 and 2011. In 2011, the ozone hole appeared in the norhthern hemisphere around the end of March.
Made by Dagik Team
Total ozone data was obserbed and provided by NASA's TOMS and OMI, http://toms.gsfc.nasa.gov/.
Earth's land Image: NASA Blue Marble by NASA's Earth Observatory (Ocean color is changed.)
Download Image (2years consecutive) (96Mbyte)
Download Image (2years simultaneous) (102Mbyte)
Land surface/core

Ground surface movement during the earthquake in 2011
Horizontal movement of the ground surface during the Earthquake on March 11, 2011
GPS data of GEONET by GSI Japan was analyzed by M. Kano et al. (Kyoto University). Time is in JST.
Made by Dagik Team
Generic Mapping Tool [Wessel and Smith, 1998] was used for plotting.
Earth's land Image: NASA Blue Marble by NASA's Earth Observatory (Ocean color is changed.)
Download image (164Mbyte)

World Map of Earthquakes from 1900 to 2007
World Map of Earthquakes whose magnitude was larger than 6.0 from 1900 to 2007
Made by Dagik Team
Data:
Centennial Earthquake Catalog by the U.S. Geology Survey
http://earthquake.usgs.gov/research/data/centennial.php
Download image (1.4Mbyte)

The geomagnetic field
The Earth's magnetic field by IGRF model.
IGRFmodel is an empirical model based on the observational data.
Made by Dagik Team
Earth's land Image: NASA Blue Marble by NASA's Earth Observatory (Ocean color is changed.)
Download: Intensity of the geomagnetic field from 1900 to 2020(prediction) (15Mbyte)
Download: Rate of change of the geomagnetic field in ten years (13Mbyte)

Anomaly of the geomagnetic field
Anomaly of the geomagnetic field by World Digital Magnetic Anomaly Map 2007http://projects.gtk.fi/WDMAM/]
Made by Dagik Team
Download image (3.1Mbyte)
Misc.

White map
3 types of white map to create your own contents. Coast lines, coordinates lines, and boarders. Boarders are as of 2002.
Made by Dagik Team
Download Image (2.3Mbyte)

Template to make your own contents
Template files to make your contents. The Earth's land image with lines of latitudes and longitudes.
Made by Dagik Team
Earth's land Image: NASA Blue Marble by NASA's Earth Observatory (Ocean color is changed.)
Download image (12Mbyte)
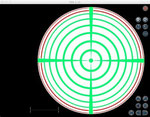
Test pattern for adjustment
Test pattern for adjustment of PC projector and images to project on a spherical screen.
Made by Dagik Team
Download image (0.7Mbyte)
ダジック・アース アプリ

展示中
サイト内検索 (search)
おすすめコンテンツ (Popular Contents)

最近数日間の雲と雨の分布 (Rainfall and clouds)

海水の塩分(Salinity of Ocean)